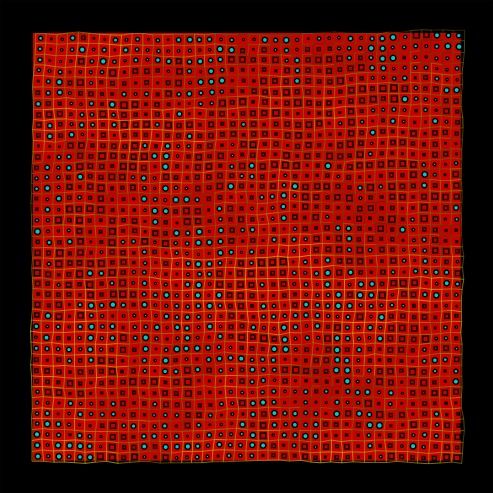
The grid module
This module will be introduced via annotated code, the first batch of which generates the image

Here's the code:
import {rs as linePP} from '/line/line.mjs';
import {rs as rectPP} from '/shape/rectangle.mjs';
import {rs as circlePP} from '/shape/circle.mjs';
import {rs as basicsP} from '/generators/basics.mjs';
import {rs as addGridMethods} from '/mlib/grid.mjs';
import {rs as addRandomMethods} from '/mlib/boundedRandomGrids.mjs';
let rs = basicsP.instantiate();

addGridMethods(rs);
addRandomMethods(rs);
rs.setName('grid_droplets');


let wd = 300;
let nr= 40
let topParams = {width:wd,height:wd,numRows:nr,numCols:nr,pointJiggle:5,framePadding:0.15*wd,frameStroke:'white'};

Object.assign(rs,topParams);
rs.initProtos = function () {
  let lineP = this.lineP = linePP.instantiate();
  lineP.stroke = 'rgb(255,255,255,1)';
  lineP['stroke-width'] = 0.5;
  let circleP = this.circleP = circlePP.instantiate();
  circleP.fill = 'rgb(00,200,200)';
  let rectP = this.rectP = rectPP.instantiate()
  this.rectP.fill = 'rgb(200,0,0)';
}

// the shapeGenerator method is called to populate each grid cell.
// in this example, the shapes generated are the little circles or rectangles.
// rvs are the random values generated by the boundedRandomGrids module.


rs.shapeGenerator = function (rvs) {
  let {which,dimension} = rvs;
  let showCircle = which > 0.5;
  let shape;
  if (showCircle) {
    shape = this.circleP.instantiate().show();
    shape.dimension = dimension;
    return shape;
  }
  shape = this.rectP.instantiate();
  shape.width = dimension;
  shape.height = dimension;
  shape.update();
  shape.show();
  return shape;
}
// The  boundaryLineGenerator method is called to draw the boundary lines.
// Again  cell coordinates are given in cell. rvs are the random values generated by the line
// this.setupBoundaryRandomizer('v',{step:30,min:100,max:250});
// in initialize.


rs.boundaryLineGenerator = function (end0,end1,rvs,cell) {
  let line = this.lineP.instantiate().show();
  line.setEnds(end0,end1);
  let y = rvs.yellow;
  line.stroke = `rgb(${Math.floor(y)},${Math.floor(y)},0)`;
  return line;
}


rs.initialize = function () {
  this.initProtos();
  this.addFrame();
  this.addBackground();
  this.setupRandomGridForBoundaries('yellow',{step:30,min:50,max:200});
  this.setupRandomGridForShapes('dimension',{step:2,min:1,max:4});
  this.setupRandomGridForShapes('which',{step:0.3,min:0,max:1});
  this.generateGrid();
}

export {rs};
Several of the parameters in
let topParams = {width:wd,height:wd,numRows:nr,numCols:nr,pointJiggle:5,framePadding:0.15*wd,frameStroke:'white',backgroundColor:'rgb(200,0,0)'};
need explanation. First, pointJiggle, if defined and non-zero, causes the points of the grid to be displaced by bounded and smoothly varying amounts. Details are here.
Next, the frame parameters: the frame facility, which draws the white rectangle around the grid, is defined in the basics module.
It is possible to modify the placement of grid points by defining positionMethod(i,j) where i is the index of the current cell in the x (width) direction, and j is its index in the y (height) direction. Here is an example:

and the code that produced it. Have a look at the positionMethod - the other operations we've seen before.
import {rs as basicsP} from '/generators/basics.mjs';
import {rs as addGridMethods} from '/mlib/grid.mjs';

let rs = basicsP.instantiate();
addGridMethods(rs);
rs.setName('grid_example2');

rs.initProtos = function () {
  rs.blineP  = linePP.instantiate();
  rs.blineP['stroke-width'] = 0.4;
  rs.blineP.stroke = 'white';

}

let nr = 32;
let wd = 200;
let topParams = {numRows:nr,numCols:nr,width:wd,height:wd};
Object.assign(rs,topParams);

rs.positionMethod = function(i,j) {
  let {width,height,numRows,numCols} = this;
  let cellht = height/numRows;
  let cellwd = width/numCols;
  let frd = i/numRows;  //fraction down
  let cwd = frd*width; // current width
  let ccellwd = frd*cellwd; // currect width of a cell
  let rs = Point.mk(-0.5*cwd + j*ccellwd,-0.5* height + i*cellht);;
  return rs;
 }

rs.boundaryLineGenerator= function (end0,end1,rvs,cell) {
	let {blineP,numRows,showMissing,lines,updating,lineIndex} =this;
	let line = blineP.instantiate().show();
  line.setEnds(end0,end1);
	return line;
}


rs.initialize = function () {
  debugger;
  this.initProtos();
  this.generateGrid();
}


export {rs};
Several position functions are provided as part of the grid module. The first is the default position function, which builds the usual sort of rectangular grid, and is installed as the initial positionMethod. The second is sidesPositionFunction, in which the endpoints of the "horizontal" (same y index) lines are placed at even intervals on two sides, sideA, and sideB. For example the following code yields the same grid as shown immediately above.
let topParams =
{numRows:nr,numCols:nr,width:wd,height:ht,framePadding:0.1*wd,
 sideA:geom.LineSegment.mk(Point.mk(0,-0.5*ht),Point.mk(-0.5*wd,0.5*ht)),
 sideB:geom.LineSegment.mk(Point.mk(0,-0.5*ht),Point.mk(0.5*wd,0.5*ht))
};
Object.assign(rs,topParams);

rs.positionMethod = rs.sidesPositionMethod;
in sidesPositionMethod, sideA and sideB can also be defined by functions which take a real input in the interval [0,1] and return a point on the plane. This allows the sides to be defined as arbitrary computable curves. For example, yet another way of producing the above grid is:
 let topParams =
{numRows:nr,numCols:nr,width:wd,height:ht,framePadding:0.1*wd,
 leftSide:geom.LineSegment.mk(Point.mk(0,-0.5*ht),Point.mk(-0.5*wd,0.5*ht)),
 rightSide:geom.LineSegment.mk(Point.mk(0,-0.5*ht),Point.mk(0.5*wd,0.5*ht)),
 sideA:function(fr) {return this.leftSide.pointAlong(fr)},
 sideB:function(fr) {return this.rightSide.pointAlong(fr)}};
Object.assign(rs,topParams);
rs.positionMethod = rs.sidesPositionMethod;
If rs.genPoint3d of type Point=>Point3d is defined, then the points on the grid (which may have been generated by a custom positionMethod) are mapped via
this.points = this.points.map((p) => this.camera.project(this.genPoint3d(p)))
Of course it is necessary to define rs.camera.